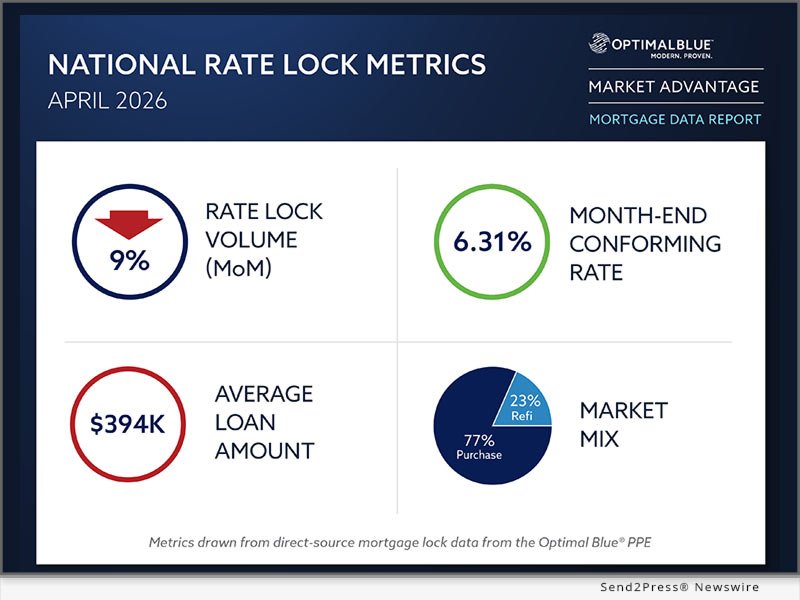
PLANO, Texas (SEND2PRESS NEWSWIRE), May 12, 2026 — Optimal Blue released today its April 2026 Market Advantage Mortgage Data Report, which revealed that mortgage lock activity slowed down after a strong quarter. Total rate-lock volumes declined 9% from month to month (MoM), but were 11% higher compared to the previous year (YoY). Purchase lock volume decreased just under 2% in March, but increased by more than 9% since April 2025. Production continued to be led by purchase lock volume as refinance activity cooled. Rate-and-term volume fell by nearly 38% MoM, but was still 22% higher YoY. Cash-out volume declined by 12% MoM, but was up 11% on a YoY basis. Refinance volume fell to 23%, down from March levels but still above the year-ago level. Image caption: Image caption Optimal Blue’s April 2026 Market advantage mortgage data report. Mortgage rates were elevated all month long, but ended the month slightly lower. The benchmark for CME Group’s Mortgage Rate Futures, the Optimal Blue Market Indices (OBMMI), 30-year conforming rate, ended the month at 6.31%. This is a 4 basis point (bps) decrease MoM. The 10-year Treasury yield ended April at 4.40%. This is up 10 bps MoM. Meanwhile, the spread between the 10-year Treasury rate and the 30-year Mortgage Rate narrowed to 191 basis points as mortgages outperformed. Mike Vough is senior vice president for corporate strategy at Optimal Blue. He said that April looks more like a cooling off from a strong quarter than a real weakness in borrower demand. “Purchase volume held up well, despite recent rate changes. Refinance volume responded more quickly.” This split shows how rate-sensitive consumers remain, even though the spring purchase market is still resilient. The sale of agency MBS increased, while bulk loan sales decreased. Mortgage servicing rights (MSRs) values also rose as higher interest rates reduced the expected refinance activity. Investor participation increased after remaining stable for three consecutive month. Vough said that lenders are paying attention to where the execution value is shown in a higher rate environment. The refi activity has cooled: Rate and term refinance volumes fell by nearly 38% MoM, but were still 22% higher YoY. Cash-out refinance volumes declined by 12% MoM, but rose 11% YoY. Refinance volume fell to 23%. Purchase activity remains steady: Purchase lock volumes declined by just under 2% MoM, but increased by more than 9% YoY. They continue to lead the overall production. Conforming share falls below 50%: For the first time, since Optimal Blue began tracking these metrics, conforming share dropped below 50% in April. FHA’s share increased to 19%. VA’s share increased to 13%. Non-conforming mortgages declined to 17%. USDA remained at 1%. Non-QM shares remain elevated: Nonqualified mortgages accounted in April for 9% of the total lock volume, up 30 basis points MoM and 233 basis points YoY. Investor and bank statement products led expanded-guideline activity. ARM levels are still high: Adjustable rate mortgages made up 10% of the total production in April, down 182 basis points MoM but roughly in line with previous year’s levels and well above norms before 2022. Property mix shifts. Single-family homes accounted for 64% of production. Planned unit developments, which are a proxy measure of new construction activity, fell to 28%. This is a 42 bps MoM decline and 328 bps YoY decline. Condo share fell to 6%. Rates and pricing Mortgage rate outperform Treasuries. The OBMMI 30-year fixed rate ended at 6.31%, down by 4 bps MoM. Jumbo rates finished at 6.43%. VA rates were 5.90%, and FHA rates were 6.06%. The 10-year Treasury rose 10 bps to 4.40 %, while the mortgage to Treasury spread shrank to 191 basis points. MSR values rise: MSRs increased 5 bps to 1.29 %, which represents a 5.16-fold increase, in line with rising rates and lower expectations for refinancing. Conventional spreads widen: Best-efforts-to-mandatory spreads increased 4 bps for conventional 30- and 15-year products, while government 30-year spreads decreased 3 bps. Lower-tier sales are increasing: Loans sold at the fourth or lower price level increased by 89 basis points to 5%. Third-tier shares increased by 21 basis points. Share of Agency MBS increases in channel and execution: Hedged loans sold to agency MBS increased 354 bps to 44 %, indicating a shift towards securitization. Bulk executions decrease: Bulk loan sales declined 257 bps, to 25%. Investor participation increases: Investor participation rose to 15 in April, after remaining at 14 over the previous three months. Product mix and borrower profile First-time buyers continue to be a significant part of the purchase market. The share of first-time homebuyers remained almost flat in April, but they continued to represent an important share of the purchase activity. They accounted for 47% conforming purchase locks; 70% FHA purchase lock; and 45% VA purchase lock. DTI ratios are stable: Purchase debt to income ratios have improved YoY. Conforming is at 36.2%; FHA is at 43.5%; and VA is at 42.7%. Credit quality remains stable: The average credit score for purchase is 735, unchanged since March. Conforming borrowers averaged 753, FHA-borrowers averaged 676, and VA-borrowers averaged 716. Pull-through rates are improving: Purchase pull-through increased to just over 80%, up 208 basis points MoM but down by 58 basis points YoY. Refinance pull through increased to just below 79%, an increase of 356 bps MoM but 1,381 bps YOY. Loan amounts are declining: The average loan was $394,046, compared to $401,100 in march and $404,586 last February. The average loan-to value ratio (LTV), was 81.64%. Loan amounts ranged between $888,871 and $302,493 for greater San Francisco, while regional LTVs ranged between 71.23% and 89.05% for San Antonio. To view the full April 2026 Market Advantage report, complete the free subscription form: https://engage.optimalblue.com/market-advantage. Subscribers will receive a PDF report each month with the most recent data. Press members are entitled to special access each month. To be added to our media list, please contact Alexandra Kreuter. Market Advantage Report Optimal Blue releases the Market Advantage mortgage reports each month to give insight into U.S. lending trends and drivers. The data is sourced from Optimal’s PPE, used to price and lock in more than one third of all mortgages across the country, and Optimal’s hedging system and loan trading system. These systems support approximately 40% of the loans that are hedged and sold on the secondary market. Optimal Blue, as the leader in mortgage technology, has a direct understanding of both secondary market activity and origination. Unlike self reported survey data, Optimal Blue’s direct-source data accurately reflects the in-process loan in lenders’ pipelines as well as secondary market executions. Subscribe to the monthly report by visiting Optimal Blue’s website. Optimal Blue does not provide any financial, legal, trading or hedging advice. Optimal Blue is a leading provider of profitability in the mortgage capital market ecosystem. Our technology, data, and integrations, as the only end-toend capital markets platform in the industry, bridge the primary and the secondary markets, helping lenders of all sizes to maximize performance, from pricing accuracy to protection of margins and everything in between. Our modern, cloud-native, technology is backed by 20 years of proven expertise. It provides real-time automation, actionable information, and seamless connectivity that lenders need to navigate volatility in the market and scale growth. Visit OptimalBlue.com to learn more about Optimal Blue’s measurable ROI. MULTIMEDIA Image link for media: https://www.Send2Press.com/300dpi/26-0512-s2p-opblue0526-300dpi.webp Image caption: Optimal Blue’s April 2026 Market Advantage mortgage data report News Source: Optimal BlueTo view the original post, visit: https://www.send2press.com/wire/optimal-blue-report-purchase-demand-holds-firm-as-april-lock-activity-cools/. This press release has been issued by Send2Press (r) Newswire for the news source. The news source is solely responsible and accountable for its accuracy. www.send2press.com.