
HealthNews
A mosaic of whole-body representations on the human precentral gyrus

Experimental procedures
Study participants
This study includes data from eight participants who each gave informed consent before any experimental procedures. Participants T5, T11, T12, T15, T16 and T17 were enrolled in the BrainGate2 Neural Interface System clinical trial (ClinicalTrials.gov Identifier: NCT00912041, registered 3 June 2009), and represent all BrainGate2 participants who were enrolled at the time the data were collected and analysed. This pilot clinical trial was approved under an Investigational Device Exemption (IDE) by the US Food and Drug Administration (FDA; Investigational Device Exemption #G090003). Permission was also granted by the Stanford University Institutional Review Board (IRB; protocol #20804), the Mass General Brigham IRB (protocol #2009P000505), the University of California, Davis IRB (protocol #1843264), the Emory University IRB (protocol #00003070) and the Providence VA Healthcare IRB. Participants C1 and C2 were enrolled under a separate multi-site clinical trial (ClinicalTrials.gov Identifier: NCT01894802, registered 10 July 2013), which was also conducted under an IDE from the US FDA and approved by the IRBs at the University of Pittsburgh and the University of Chicago. C1 and C2 represent all participants enrolled under NCT01894802 who were available at the time of data collection to participate in this study, given competing demands on participant time for other research goals. All research was performed in accordance with relevant guidelines and regulations.
Recognizing that cortical mapping and neural activity recording in humans introduces distinctive ethical and philosophical considerations, ethics oversight was embedded from the outset. All risks (including surgical risks) arise solely from the parent safety and feasibility trials (and not the present study), each approved and monitored by local IRBs. Additional safeguards were provided by multiple and in part redundant additional layers of protection, including continuous oversight from local Clinical Oversight Committees including an independent medical monitor, a Data Safety and Monitoring Board, strict adherence to FDA guidance on conduct and safety under our IDE, clinical trial offices from the US National Institutes of Health (NIH), and engagement with the Neuroethics Working Group (NEWG) of the NIH BRAIN Initiative, to ensure adherence to the highest standards of safety and ethical rigour. All study procedures complied with the Declaration of Helsinki, the Belmont Report, CIOMS guidance and the NIH BRAIN Neuroethics Principles. In the parent clinical trials, a months-long, dialogue-driven consent process safeguards participant autonomy and adapts to evolving communication needs, protecting participant privacy. During this process, we explained that there would be no direct benefits from the implanted device. Within the trials, proactively embedded neuroethics expertise encourages continual reflection on risk–benefit balance, participant welfare and societal impact.
T5 is a right-handed man, 69 years of age at the time of this study, with tetraplegia due to cervical spinal cord injury (classified as C4 AIS-C), which occurred approximately 9 years before enrolment in the clinical trial. T5 has two 96-channel intracortical microelectrode arrays (Blackrock Microsystems; 1.5-mm electrode length) placed in the hand-knob area of the left PCG. The hand-knob area was identified anatomically by preoperative MRI. T5 has full movement of the face and head and the ability to shrug his shoulders. Below the level of the spinal cord injury, T5 has very limited voluntary motion of the legs and arms.
T11 is a right-handed man, 38 years of age at the time of this study, with tetraplegia due to a cervical spinal cord injury (classified as C4 AIS-B), which occurred approximately 14 years before. T11 has two 96-channel intracortical microelectrode arrays (Blackrock Microsystems; 1.5-mm electrode length) placed in the left dorsal PCG, targeting the hand-knob area as identified anatomically by preoperative MRI. T11 has full movement of the face and head with very limited voluntary motion of the arms.
T12 is a left-handed woman, 67 years of age at the time of this study, with slowly progressive bulbar-onset ALS. T12 was diagnosed at age 59 with an ALS-Functional Rating Scale score of 26 at the time of study enrolment. T12 has four 64-channel intracortical microelectrode arrays (Blackrock Microsystems; 1.5-mm electrode length) placed in the left (language dominant, motor non-dominant) hemisphere, based on preoperative anatomical MRI, fMRI and cortical parcellation using the Human Connectome Project (HCP)32 multi-modal parcellation pipeline (see Extended Data Fig. 5 for cortical parcellation results). Two arrays were placed in the inferior frontal gyrus (not included in this study), and two arrays were placed in the ventral PCG, targeting area 6v; see Willett et al. for more details56. T12 remains functionally independent with 3–4 out of 5 strength (assessed using the Medical Research Council (MRC) scale) in all limbs, but is anarthric (able to vocalize, but unable to produce intelligible speech).
T15 is a left-handed man, 45 years of age at the time of this study, with ALS (ALS-Functional Rating Scale score of 23 at the time of study enrolment). T15 has four 64-channel intracortical microelectrode arrays (Blackrock Microsystems; 1.5-mm electrode length) placed in the left (language dominant, motor non-dominant) PCG, based on preoperative anatomical MRI and HCP cortical parcellation (see Extended Data Fig. 5 for cortical parcellation results). One array was placed targeting area 55b, two arrays targeting area 6v and one array targeting area 4; see Card et al. for more details61. T15 has limited orofacial movement with the capacity for vocalization, but is unable to produce intelligible speech. T15 has very limited voluntary motion of the rest of the body.
T16 is a right-handed woman, 52 years of age at the time of this study, with tetraplegia and dysarthria due to a pontine stroke approximately 19 years before enrolment in the BrainGate2 clinical trial. T16 has four 64-channel intracortical microelectrode arrays (Blackrock Microsystems; 1.5-mm electrode length) placed in her left PCG: two in the hand-knob area (targeting area 6d), one in the speech-related ventral premotor cortex (targeting ventral area 6v) and one in the middle PCG (targeting area 55b). Implant area targets were identified by the HCP multimodal cortical parcellation procedure (see Extended Data Fig. 5 for the cortical parcellation results). Examination of post-implant array locations indicated that the middle PCG array appears to be on the border between area PEF and 55b. T16 is able to speak slowly and quietly, but speech cadence is reduced due to poor diaphragm voluntary control. She has limited voluntary control of her upper extremities, with some shoulder motion and some slow and contractured wrist and finger movements. She has limited-to-no voluntary control of her lower extremities. Sensation for T16 is fully intact.
T17 is a right-handed man, 33 years of age with a history of rapidly progressive ALS. T17 has six 64-channel intracortical microelectrode arrays (Blackrock Microsystems; 1.5-mm electrode length) placed in the left hemisphere, based on preoperative anatomical MRI, task-based fMRI and cortical parcellation using the HCP multimodal parcellation pipeline. Two arrays were placed in the dorsal PCG (targeting area 6d), two arrays were placed in the ventral PCG (targeting area 6v) and two arrays were placed in area 55b. At the time of this study, T17 is quadriplegic, anarthric and ventilator dependent. His only remaining volitional motor control is over his extra-ocular movements.
C1 is a right-handed man, 57 years of age at the time of implant, who presented with a C4-level ASIA-D spinal cord injury that occurred 35 years before implant. C1 has four microelectrode arrays (Blackrock Microsystems; 1.5-mm electrode length) placed in the left hemisphere. Two 96-channel microelectrode arrays were implanted in the arm and hand area of the motor cortex and two other 32-channel arrays (not included in this study) were implanted in the somatosensory cortex. Targeted array placement was based on functional neuroimaging (fMRI) of the participant attempting to make movements of the hand and arm, within the constraints of anatomical features such as blood vessels and cortical topography; see Greenspon et al. for more details62. C1 had no control of the intrinsic or extrinsic muscles of the right hand but retained the ability to move his arm with noted weakness in many upper limb muscles. He retained impaired, but largely functional, movement of the other limbs, full control of head and face movement, and could speak fluently. The data included here were collected 3.25 years post-implant.
C2 is a right-handed man, 60 years of age at the time of implant, who presented with a C4-level ASIA-D spinal cord injury and right brachial plexus injury that occurred 4 years before implant. C2 has four microelectrode arrays (Blackrock Microsystems; 1.5-mm electrode length) placed in the left hemisphere. Two 96-channel microelectrode arrays were implanted in the arm and hand area of the motor cortex and two other 32-channel arrays (not included in this study) were implanted in the somatosensory cortex. Targeted array placement was based on functional neuroimaging (fMRI and magnetoencephalography) of the participant attempting to make movements of the hand and arm, within the constraints of anatomical features such as blood vessels and cortical topography62. C2 retained full control of his entire body except for right hand and arm movement. He could speak fluently. The data included here were collected 0.75 years post-implant.
Neural signal processing
For each participant, neural signals were recorded from the microelectrode arrays using the NeuroPort system (Blackrock Microsystems). The signals were then analogue filtered (fourth-order Butterworth with corners at 0.3 Hz to 7.5 kHz) and digitized at 30 kHz (250-nV resolution). The subsequent digital filtering and neural feature extraction methods differed between participants due to variations in the systems at different sites.
For T5, T11 and T12 the signals were decimated to 15 kHz and band-pass filtered between 250 Hz and 4,900 Hz using a fourth-order zero-phase non-causal Butterworth filter. Linear regression referencing (LRR) was then applied to further reduce ambient noise artefacts63 before spike detection. Spike threshold crossing detection was implemented using a −4.5 × RMS threshold applied to each electrode, where RMS is the electrode-specific root mean square of the time series voltage recorded on that electrode.
For T15, the signals were band-pass filtered between 250 Hz and 5 kHz using a fourth-order zero-phase non-causal Butterworth filter, and LRR was then used to reduce noise artefacts. Spike threshold crossing detection was implemented using a −4.5 × RMS threshold.
For T16, each electrode was high-pass filtered with a 250 Hz cut-off using a fourth-order zero-phase non-causal Butterworth filter. LRR was used for noise reduction and artefact removal with parameters computed post-filtering from a dedicated reference block at the beginning of the session. A −3.5 × RMS threshold was applied to each electrode for spike threshold crossing detection.
For T17, the signals were decimated to 15 kHz and band-pass filtered between 250 Hz and 5,000 Hz using a fourth-order zero-phase non-causal Butterworth filter. LRR was then applied to further reduce ambient noise artefacts before spike detection. Spike threshold crossing detection was implemented using a −3.5 × RMS threshold applied to each electrode.
For participants C1 and C2, a high-pass filter (250 Hz) was applied to each electrode before spike detection. Spike threshold crossing detection was implemented using a −4.5 × RMS threshold applied to each electrode.
The resulting spiking data from each participant mentioned above was binned in 20-ms bins for offline analyses and decoding as presented throughout this study.
Overview of data collection sessions and cued movement task
For each participant, neural data were recorded in a single ‘session’ on a scheduled day. During the session, the participant was seated in a chair in front of a computer monitor at an idle and relaxed position (with the exception of participants T5 and T17, who were lying in a bed at an incline). Each participant completed a series of 5–10 min ‘blocks’ of the cued movement task, consisting of an uninterrupted series of trials. Supplementary Table 1 lists all data collection sessions reported in this work. Variation in the number of trials and/or blocks collected for each participant is due to differences in session durations for each participant and their respective comfort and/or fatigue levels.
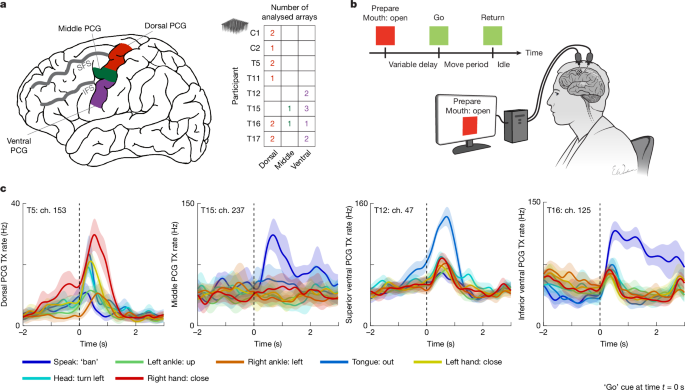
The cued movement task followed a simple instructed delay paradigm (Fig. 1b). During the instructed delay period, a red square and text appeared in the centre of the screen indicating to the participant that they should prepare to make the specified movement. The instructed delay period varied randomly (except for participants C1 and C2), with the range tailored to preference of each participant for sufficient time to read the prompt and prepare the movement. After the delay, the square turned green and the text indicating the movement changed to ‘go’, at which point the participant executed the movement immediately. The participant was instructed to make the movement if they were able to overtly move that body part, otherwise they were instructed to attempt the movement. They were then directed to continue attempting the movement, or holding the posture of the completed movement until the text changed to ‘return’, at which point the participant relaxed and returned to a neutral posture. Typically, the movement period lasted 1.5 s and the return period lasted 1 s, although these durations were adjusted if participants required more time to complete the task. See Supplementary Table 2 for task timing parameters.
A standardized document describing task details of the whole-body movement sweep was shared with each site before data collection. Participants were instructed to prioritize isolated and consistent attempted movements. The following text summarizes the key task elements and instructions provided in that document.
The session design details included: “This session is to collect open-loop attempted movements for various effectors across the entire body. We ask the participant to attempt or make a single isolated movement which is cued via text on a computer monitor in a delayed movement task. As the participant attempts the cued movement, neural data is recorded”.
Key notes included:
Make sure the idle or neutral body position of the participant is comfortable and that they are not inherently attempting or making any movements while in an idle position
Please try not to move until the go cue occurs
Only move the body part that is being cued, please try not to move any other body part (isolated movements)
Please keep all movements as consistent as possible (for example, move the right ankle up the same way each time)
Sustain the movement throughout the go period (for example, flex the left wrist throughout the duration of the go period until the return period is cued at which point return to idle)
Ask the participant to refrain from speaking during the block (as speaking is one of the tested conditions)
Before session start, please go over the cued movements with the participant (show them demonstrations of the movements).
An excerpt of the script included: “You will be performing a series of single movements. The movements will be cued in text on the screen accompanied by a coloured square. Each trial starts with the cued movement being presented with a red square. The red square means ‘prepare’, so please prepare to make the movement, but try your best not to move until the ‘go’ cue. The ‘go’ cue occurs shortly after when the square turns green and is accompanied by a beep. At this time, please attempt only the movement that is cued. Another beep will then follow with a ‘return’ prompt, indicating that you should return to an idle or neutral state. When presented with a ‘do nothing’ cue, please try not to make any movements and remain at idle”.
In addition to these standardized instructions, participants were coached during a practice block at the beginning of the session to attempt each cued movement in a light and controlled manner, as opposed to straining against their paralysis (which could induce unintended co-movement of other joints). Researchers visually monitored for non-isolated movements and provided feedback as needed. If participants appeared to recruit other joints in an attempt to generate overt motion of the cued joint, they were instructed to instead isolate their movement attempts to the cued joint only, even if doing so would result in no overt motion being generated. Researchers either read the script verbatim or paraphrased in an extended discussion with the participant.
Neural representations of whole-body movements in the motor cortex
Peristimulus time histograms
To generate the peristimulus time histograms shown in Fig. 1c, we first started with binned threshold crossing (TX) spike counts (20-ms bins). For visualization purposes, we denoised the data by convolving the TX counts of each electrode with a Gaussian smoothing kernel (120 ms s.d.). Next, for each electrode, we extracted TX counts for each trial in a −2-s to 2.5-s time window relative to the ‘go’ cue of each trial. For each of the movement conditions (see Fig. 1c legend), we computed the mean and 95% CIs (estimated using MATLAB’s normfit function) for the TX counts in each time bin across all trials. We then scaled the resulting means and CIs (multiplying by \(\frac{1}{0.02{s}}\)) to convert them into units of Hz.
Neural-tuning strength
Note that the neural population analyses discussed in this section rely heavily on the cvVectorStats library of functions for using cross-validation to estimate Euclidean distance between the means of multivariate distributions (and for estimating other statistics that require Euclidean distance, such as Pearson’s correlation). This library has been extensively used in our previous reports37,41,56,64 (see the code repository on GitHub (https://github.com/fwillett/cvVectorStats)).
Tuning strength heat maps. The neural-tuning strength heat maps shown in Fig. 2a were generated using cross-validated estimates of Euclidean distances between the distribution of population-level neural firing rates for a control ‘do nothing’ condition and the distribution of firing rates for a specific movement condition (see Fig. 2a column labels for each movement condition).
We first started with binned TX counts (20-ms bins) for each array. To account for drifts in mean firing rates across the session, the TX rates were mean subtracted within each block (that is, for each electrode, its mean firing rate within each block was subtracted from the binned spike count for each time step). Next, for each trial and electrode, TX counts were averaged in the entire time window following the ‘go’ cue, accounting for a 300-ms reaction time to cue onset (see Supplementary Table 2 for analysis windows for each participant). This yields an N × 1 neural firing rate vector for each trial, where N is the number of electrodes. For each unique movement condition, including the ‘do nothing’ condition, we stacked the firing vectors for each trial to create a T × N matrix, where T is the number of trials for that specific movement condition. Next, we estimated the Euclidean distance between the ‘do nothing’ firing vectors and the firing vectors for each unique movement condition using the cvDistance function in the cvVectorStats library. cvDistance also returns 95% CIs via jackknife resampling (see Supplementary Table 3 for statistical details). If the confidence interval contained 0, the tuning strength was considered insignificant relative to the ‘do nothing’ condition (denoted by a white ‘X’). To compare tuning strengths across arrays and participants whose neural data may differ in signal quality, the Euclidean distances calculated for each array (that is, each row of the heat map) were normalized by the maximum Euclidean distance in that row.
Movement set-wise tuning strength across spatially organized arrays. For Fig. 2b, we plotted the microelectrode arrays as they appeared on the PCG to better interpret how they are tuned as a function of their spatial location. We used anatomical landmarks to position the arrays relative to each other across participants in a generic space.
The brain surface depicted in the left-most panel of Fig. 2b is the HCP’s group-averaged pial surface (HCP S1200 (refs. 32,65)). The superior frontal sulcus (SFS) and inferior frontal sulcus (IFS) are illustrated by hand-drawn black lines and are easily identifiable landmarks despite variability in brain folding across individuals. We then defined the extremes of the crown of the PCG as ‘superior’ and ‘inferior’. Using the MRI-derived brain anatomies for each participant, we approximated the location for each array relative to these four landmarks for plotting purposes (right panels of Fig. 2b).
For each microelectrode array, tuning strength to each movement set (speech, face, head, right arm, right leg, left arm and left leg) was computed by averaging the tuning strengths across the sub-movements within each set (that is, averaging the relevant entries in Fig. 2a before row-wise normalization). Sub-movements with no statistically significant tuning (that is, cells with white ‘X’) were still included in the average. Computing set-wise averages yields a tuning strength matrix of size A × S, where A is the number of arrays and S is the number of movement sets. The set-wise tuning strength matrix was then row-wise normalized by the maximum value. Next, each microelectrode array (square) in Fig. 2b was coloured according to the corresponding value in this normalized matrix.
Recurrent neural network classifier
For Fig. 3, we used the recurrent neural network (RNN) decoding architecture described in our previous work56 to classify movements using single-trial neural recordings. For each trial, binned TX spike count time series from a 4-s window after the go period were used as input to the RNN. Binned TX spike counts were block-wise mean subtracted to remove firing-rate drifts across the session. The RNN was trained on all movement classes and arrays simultaneously, with a separate input layer for each array (using the same methods as in ref. 56, in which separate input layers were used for each day of data). Training separate input layers helps to place the data into a common space before processing by the RNN. To account for different array sizes (64 versus 96 electrodes), data from 64-electrode arrays were zero padded to increase the dimensionality to 96. All hyperparameters were the same as those used in our previous work56, except instead of using the connectionist temporal classification (CTC) loss, we used a cross-entropy loss applied to a linear readout from the last RNN layer (using the PyTorch function torch.nn.CrossEntropyLoss).
We used fivefold cross-validation to estimate classification accuracy (5 RNNs were trained on 80% of the trials each and tested on the remaining 20%). Only a single RNN was trained for each fold to classify all movements across all arrays (as opposed to training RNNs separately for each movement category and array). When computing classification accuracy for a particular movement category, the decoder output was constrained to be one of the relevant movements from that category only (the maximum probability output within the allowable set was chosen as the final output). Classification accuracies were considered statistically significant if their 95% CIs did not intersect chance level. The 95% confidence intervals for the classification accuracies were calculated using binofit in MATLAB. The chance level was calculated as \(\frac{1}{C}\), where C is the number of conditions within each set.
PCA of array-tuning properties
To make Fig. 4a, normalized modulation magnitudes for each category of movement (as depicted in Fig. 2a) and classification accuracies (as depicted in Fig. 3a) were concatenated together for each array to produce a 20 × 14 matrix (20 arrays, 7 + 7 accuracies and normalized modulation magnitudes). Classification accuracies were expressed as success rates varying from 0 to 1, and normalized modulation magnitudes also varied from 0 to 1. PCA was then applied to the rows of this matrix to find the dimensions that explained the most variance in array-tuning properties (these two principal components are depicted in Fig. 4b). Array-tuning properties were then visualized in this two-dimensional space (Fig. 4a), and each array was coloured using an HSV colour scheme. The hue of each point (x, y) in this space was determined by the angle atan2(y, x), the saturation was determined by the magnitude \(\sqrt{{x}^{2}+{y}^{2}}\,\), and the value was set to 0.85. Saturation values were clipped at 1.
Correlation between homologous limb movement representations
Figure 5a and Extended Data Fig. 7 show average pairwise correlations (Pearson’s r) between the neural representations of homologous limb movements.
First, following the same pre-processing steps as in the ‘Tuning strength heat maps’ section, binned TX spike counts for each microelectrode array were block-wise mean removed, and neural firing rate vectors were computed by averaging the TX counts within the go period window (Supplementary Table 2) for each trial. Firing-rate vectors were then concatenated into T × N matrices for each movement condition m, where T is the number of trials for movement m and N is the number of electrodes within an array. Before computing the correlations, we subtracted the average firing rate within each movement set to remove any effector-dependent neural dimensions such as the potentially large laterality and arm versus leg dimensions reported in previous work37,41. For example, for arm movements, we averaged across all neural vectors for movements within the arm set, creating a 1 × N average vector, which was then subtracted from the neural vectors within this arm set. Next, for each pair of movements (mi and mj), the corresponding concatenated firing-rate matrices were used to compute the cross-validated correlation between the mean firing-rate vectors of each movement (cvCorr function from the cvVectorStats library). The correlation matrices were then averaged across arrays within the following sets: the dorsal PCG, the middle PCG, the superior ventral PCG and the inferior ventral PCG. See the row labels of Fig. 2a for how the arrays were grouped into these sets.
For Extended Data Fig. 7, note that the row–column entries of the correlation matrices for ‘right arm–left arm’ and ‘right leg–left leg’ were re-ordered to align movements that are the same in joint-angle space as opposed to extrinsic, Cartesian space. For example, ‘right arm–raise right’ is homologous to ‘left arm–raise left’. This aligns with our previous reports that showed that directional movements were correlated across effectors in intrinsic space37,41.
The heat map in Fig. 5b indicates the average correlation between homologous movements for limb pairs (column entries) for each microelectrode array (row entries). Each cell represents the mean of the diagonal values of the corresponding correlation matrix for each limb pair. A statistical test for significance was performed by a shuffle-control test (the black ‘X’ indicates non-significant correlation between homologous movements). See Supplementary Table 3 for statistical details.
Movement-independent neural coding of laterality
We used PCA to visualize the neural activity, in select microelectrode arrays, in a lower-dimensional space as illustrated in Fig. 5c. First, binned TX spike counts were block-wise mean removed and z-scored (mean subtracted and divided by the standard deviation) for visualization purposes. Next, firing-rate vectors were computed for each trial by averaging the counts within the ‘go’ period windows (Supplementary Table 2). We then concatenated all of the firing-rate vectors for right and left arm movements into a matrix of size T × N, where T is the total number of trials and N is the number of electrodes. PCA was performed on this monolithic matrix and each z-scored firing-rate vector was subsequently projected onto the top two principal components (PCs). The single-trial projections were coloured by the corresponding movement set (right arm trials in red, and left arm trials in blue). See Supplementary Table 3 for details on the number of trials.
The heat map in Fig. 5d summarizes the size of laterality-related tuning using a variation of demixed PCA66 (dPCA; https://github.com/machenslab/dPCA). A core concept of dPCA involves marginalizing neural data across different experimentally manipulated factors or variables. Each marginalization averages across variables not in the set, creating a data tensor that captures the effect of those factors on the neural activity. Using the dPCA library, we applied a cross-validated variance computation to estimate the amount of variance in the neural activity due to each factor while reducing bias41. To reduce bias when estimating variance, we split the trials into twofolds and computed the marginalizations separately for each fold. We then estimated the covariance matrix of each marginalization as \({X}_{1}{X}_{2}^{T}\), where X1 is the marginalization computed on fold 1 and X2 is the marginalization computed on fold 2. We then took the real part of the eigenvalues of \({X}_{1}{X}_{2}^{T}\) to estimate the variance of each component. The data were marginalized into the following four factors: laterality (left or right arm), movement type (arm raise left, arm raise right, hand close, hand open, wrist up, wrist down, wrist left and wrist right), laterality–movement type interaction and time. We computed the cross-validated variance in the aforementioned factors for each microelectrode array. Each cell of the heat map in Fig. 5d represents the cross-validated marginalized variance for each factor (labelled along the x axis) across each microelectrode array.
Intermixed tuning within electrodes
Extended Data Fig. 1a shows matrices that indicate whether an electrode was significantly tuned to an individual movement. To assess significant tuning, we first started with binned TX spike counts that were block-wise mean removed. Next, for each trial and electrode, we averaged the TX counts within the ‘go’ period window. Significance of tuning was then assessed via a two-sample, two-sided Student’s t-test (using the ttest2 function in MATLAB) applied per electrode, where group 1 comprised the single-trial average firing rates for movement m, and group 2 comprised the single-trial average firing rates for the ‘do nothing’ condition (see Supplementary Table 1 for the number of trials per condition). This two-sample t-test was performed for each movement (P < 0.00001 defined significance). Electrodes that were significantly tuned to a movement appear as a filled in circle in Extended Data Fig. 1a.
The heat map in Extended Data Fig. 1b summarizes the fraction of electrodes that exhibited significant tuning to at least one movement within each movement set as computed in Extended Data Fig. 1a. The heat map in Extended Data Fig. 1c summarizes the fraction of electrodes that had statistically significant tuning to each possible number of movement sets (from 0 to 7). The colour bar is clipped at 0.5 to better visualize the range of values. Extended Data Fig. 2a,c,d repeat the corresponding analyses in Extended Data Fig. 1a–c for spike-sorted single units, restricted to units with mean firing rates of 2–200 Hz.
Neural dimensionality of canonical and non-canonical movements
Extended Data Fig. 3 summarizes the dimensionality of neural activity evoked by movement subsets classified as ‘canonical’ (classically homuncular) or non-canonical in the dorsal and ventral PCG regions. In the dorsal PCG, canonical movements were defined as arm and hand movements, whereas non-canonical movements were defined as speech and face movements. In the ventral PCG, speech and face movements were defined as canonical, whereas arm and leg movements were defined as non-canonical.
To estimate the spatial dimensionality of non-canonical movements, we applied cross-validated PCA (see Stringer et al. for further details67). For each array, binned threshold crossing counts were block-wise mean removed and reshaped into a four-dimensional data tensor of shape N × C × T × R, where N is the number of electrodes, C is the number of non-canonical movement conditions, T is the number of time bins in the ‘go’ window, and R is the number of trial repetitions.
The cross-validated PCA procedure was applied by averaging neural activity within the analysis window (that is, over the T dimension), yielding a matrix of shape N × C × R. This matrix was then split randomly into two halves across repetitions to create independent datasets X1 and X2. Each dataset was then trial averaged, yielding matrices of shape N × C. X1 and X2 were then projected onto the PCs from X1. Shared variance was computed via dot products of matching PC projections across splits. This process was repeated 100 times with different trial splits, and the average cumulative shared variance with 95% CIs was plotted (Extended Data Fig. 3a).
Extended Data Fig. 3b shows the ratio of non-canonical-to-canonical movement-related neural activity, computed using cross-validated neural distances (cvDistance; see the ‘Tuning strength heat maps’ section). For each array, we calculated pairwise neural distances within the non-canonical and canonical movement sets. The modulation ratio was defined as the average distance within the non-canonical set divided by the average distance within the canonical set. A similar approach was used for Extended Data Fig. 2b, except that all single-sorted units were pooled across dorsal arrays and separately across ventral arrays (only including units with a 2–200-Hz mean firing rate). This pooling was necessary due to the limited number of sorted units per array, which made within-array neural distance estimates unreliable. To match trial counts across participants in the pooled sorted-unit analysis, we used, for each array set, the minimum number of trial repetitions available across participants (12 trial repetitions per movement condition for the dorsal set, 7 trial repetitions per movement condition for the ventral set); for participants with more trials than this minimum, trials were randomly selected without replacement. Cross-validated pairwise neural distances were then computed for the dorsal and ventral pools, independently, and modulation ratios were calculated. Jackknife resampling was used to estimate 95% CIs.
Data exclusion
Microelectrode array recordings may not be representative of the neural population tuning in a cortical area if they fail to record a sufficient amount of tuned spiking activity. To test whether an array contained any movement-related information, we used a cross-validated (tenfold) Gaussian naive Bayes classifier (following the methods described in ref. 37) applied to a 100-ms sliding window of neural activity. We found that four microelectrode arrays (C2-d1, T11-d2, T17-m1 and T17-m2) failed to demonstrate consistently above-chance classification performance for any time epoch, when classifying from among all 46 movements (Extended Data Fig. 10), and were thus excluded from this study and all other main results.
Also of note is that the neural recordings of participant C1 exhibited large noise when they attempted movements of the head moving up and down, which may have mechanically disturbed the pedestals fixed to the head or the cables. These two head conditions were removed for participant C1 for all population-level tuning analyses.
HCP parcellation, resting-state networks and motor task activations
For all HCP results presented in this study, we analysed the WU-Minn HCP 1200 Subjects Group Average Data Release32,65 and the original 210 subject release32. This data includes group-averaged structural data, functional connectivity data and task fMRI data. The Connectome Workbench (v1.5.0; www.humanconnectome.org), an open-source visualization and discovery tool, was used to explore and analyse the data generated by the HCP.
Group cortical parcellation
Extended Data Fig. 5 (first panel) displays the group-averaged pial surface of the left hemisphere with 180 areas delineated and identified by the HCP’s multi-modal parcellation32 (HCP_MMP1.0). To generate this panel, we loaded the HCP_S1200_GroupAvg_v1.scene file into the Connectome Workbench and selected the ‘Cortical Parcellations’ scene (scene 5). Next, we viewed the pial surface of the left hemisphere (S1200.L.pial_MSMAll.32k_fs_LR.surf.gii) and overlaid the cortical parcellations (Q1-Q6_RelatedValidation210.CorticalAreas_dil_Final_Final_Areas_Group_Colors.32k_fs_LR.dlabel.nii) with modifications to the colour scheme. We enabled the borders and selected only the following regions to display: L_4_ROI, L_6mp_ROI, L_6d_ROI, L_6v_ROI, L_PEF_ROI, L_FEF_ROI and L_55b_ROI.
Resting-state fMRI networks for language and arm movement
The resting-state networks shown in Extended Data Fig. 4 were generated using the same scene file in the section ‘Group cortical parcellation’ and overlaying resting-state networks 25 and 28 (Q1-Q6_RelatedParcellation210.individual_RSNs_d40_WR_norm_MSMAll_2_d41_WRN_DeDrift.32k_fs_LR.dscalar.nii; file can be found at https://balsa.wustl.edu/study/RVVG). Networks 25 and 28 were highlighted as a language network and upper limb network, respectively, by Glasser et al.32.
Task fMRI activations
Extended Data Fig. 6b shows task fMRI activations for the group-averaged HCP S1200 dataset. The same main scene file from section ‘Group cortical parcellation’ was used with the ‘S1200 task fMRI Cohen’s D effect-size maps’ scene loaded (scene 3). The task activation file HCP_S1200_997_tfMRI_ALLTASKS_level2_cohensd_hp200_s2_MSMAll.dscalar.nii was used for overlay visualization. Only task fMRI activation maps for right-hand (map tfMRI_MOTOR_RH) and tongue (map tfMRI_MOTOR_T) movements were displayed. For visualization, the following display settings were applied to each task activation file: ‘source’ was set to ‘self’, ‘high’ to 1.308, ‘low’ to −3.057, ‘Abs Pct’ was toggled on, with ‘Pos Max’ set to 99.5 and ‘Pos Min’ to 2, and the colour palette set to ‘black-blue-positive’ and ‘black-red-positive’ for the right hand and tongue, respectively. The opacity was set to 0.55 for both maps.
Functional connectivity map for the somato-cognitive action network
Extended Data Fig. 6a shows a functional connectivity map for the group-averaged HCP S1200 dataset. The same main scene file from section ‘Group cortical parcellation’ was used with the ‘S1200 fcMRI, full correlation’ scene loaded (scene 4). The correlation file HCP_S1200_1003_rfMRI_MSMAll_groupPCA_d4500ROW_zcorr was used for overlay visualization only. The seed point was manually selected to best match the location reported by Gordon et al.15 to identify the somato-cognitive action network (SCAN).
To enhance visualization of the SCAN, the following display settings were adjusted in the settings panel of the correlation file: the ‘Source’ was set to ‘self’, ‘high’ threshold to 0.9, ‘low’ threshold to −1, ‘Abs Pct’ was toggled on, with ‘Pos Max’ set to 99.5 and ‘Pos Min’ to 2. The resulting SCAN visualization is shown in Extended Data Fig. 6b.
For Extended Data Fig. 6b, array locations were manually selected on the individual HCP pial surface of each participant (in MSMAll space), with locations estimated using surgical photos, and then projected onto the HCP group-averaged pial surface (also in MSMAll space) within the Connectome Workbench. As a result, the spatial ordering of arrays may differ from the anatomically aligned organization shown in Fig. 2b, which is based on the sulcal landmarks IFS and SFS.
For Extended Data Fig. 6c, we used the HCP-style multimodal surface registration for each participant (MSMAll) to project the HCP group-averaged SCAN network and hand–tongue task-fMRI activation maps onto the pial surface of that participant (all in MSMAll space).
Quantifying movement using optical flow
To collect video evidence demonstrating that neural correlations between limbs were not caused by inadvertent co-movement of uninstructed effectors, participant T12 performed an additional abridged version of the whole-body cued movement task, involving only movements of the four limbs (arms and legs), while video recordings captured her limb movements (trial day 1,064, blocks 5–16). T12 retains residual voluntary motion and demonstrates isolated movements of her limbs (Supplementary Video 1). To quantify limb motion, dense optical flow was computed using the Farneback method (calcOpticalFlowFarneback function from the cv2 package in Python with the following standard parameter settings: ‘flow’ to ‘none’, ‘pyr_scale’ to 0.5, ‘levels’ to 3, ‘winsize’ to 15, ‘iterations’ to 3, ‘poly_n’ to 5, ‘poly_sigma’ to 1.2, and ‘flags’ to 0) across consecutive frames of each video. For each frame, the optical flow vector within each region was calculated, and its magnitude was used to generate a time series of movement intensity for each limb. This analysis is summarized in Extended Data Fig. 8c.
Statistics
Supplementary Table 3 lists statistical details for each CI or hypothesis test reported in this work. In this study, uncertainty was quantified mainly with 95% CIs.
Reporting summary
HealthNews
Cervical cancer deaths fall to zero in young women given vaccine


Around 200 lives have been saved in England so far thanks to a vaccine which protects against cervical cancer, according to analysis published in the Lancet.
The first study of its kind showed that deaths have fallen sharply since school-age girls were offered the human papillomavirus (HPV) jab in 2008.
Between 2020 and 2024, no cervical cancer deaths were recorded in women aged 20 to 24 – the first time that had happened over a five-year period.
Without vaccination, around 23 deaths would have been expected.
“It’s incredible to think that a single jab can almost eliminate a particular type of cancer,” said Prof Peter Sasieni, the lead researcher at Queen Mary University of London.
The study also found that those children vaccinated at age 12 or 13 now have close to zero risk of dying from the disease before the age of 30.
Before the HPV vaccination campaign, around 20 deaths every year were being recorded in that age group.
Overall, cervical cancer is still the 14th most common cancer among females in the UK, with 3,300 people diagnosed every year.
It is thought HPV, a virus which is spread through close skin-to-skin contact, causes 99% of those cases.
Most HPV infections clear up without any problems, but some cause abnormal cell changes and can lead to cancer years later.
The report’s authors expect the numbers dying from the disease to continue to fall as more are given a HPV jab and vaccinated people grow older.
Cancer Research UK, which funded the research, described the findings as an “incredible milestone” but warned that vaccination rates in England were running below recommended levels.
“We know the HPV vaccine is extremely effective at stopping cervical cancer before it starts and for the first time these findings show it is saving lives,” said the organisation’s chief executive Michelle Mitchell.
‘I’m a real advocate for this vaccine’
Alexandra Legg left school just before the HPV vaccine was introduced in England.
In 2021, just as she was planning her wedding, she was diagnosed with cervical cancer aged 30.
“I remember hearing the words and I just couldn’t really breathe very well,” she says.
“I was so upset – everything went through my head, it was so hard.”
Her treatment involved the removal of lymph nodes in her abdomen, although surgeons were able to preserve a small part of her cervix, giving her a chance of becoming pregnant.
Just a year later, Ivy was born. Her middle name is Marvella – meaning “miracle”.
“Those nine months were so scary because I was at such risk of losing her at any point,” she says.
Alexandra says her life could have been far less traumatic if she had been offered the HPV vaccine and urged those eligible to get it.
“I’m a real advocate for this vaccine and when Ivy is old enough, she’ll be first in the queue,” she adds.
Reduction in deaths ‘tip of the iceberg’
Prof Sasieni, who specialises in cancer epidemiology at Queen Mary University of London, describes the reduction in deaths since the introduction of the vaccine as the “tip of the iceberg”.
“As vaccinated generations grow older, we’ll see many more lives saved from cervical cancer,” he adds.
“New research shows just how vital it is to keep HPV vaccination levels high so more people are protected.”
The UK government has pledged to eliminate cervical cancer as a public health problem by 2040.
But the latest data shows vaccination rates across the country have fallen below recommended levels.
Data from the UK Health Security Agency shows that 76% of girls in England were vaccinated by the age of 15 in 2024-25, well below the 90% that the World Health Organization (WHO) says is needed to eliminate cervical cancer.
“It’s essential that the UK Government and health systems urgently address this with targeted action to reach communities where uptake is the lowest,” says Michelle Mitchell at Cancer Research UK.
Despite the rollout of the HPV vaccine, women aged 25 to 64 are still advised to attend cervical screening (formerly known as a smear test).
Boys have also been given the HPV vaccine since 2019, which helps to protect them against anal, penis, throat and mouth cancers, and reduces the risk of them passing the virus on to girls.
HPV self-testing kits are also being sent out to women who have not yet come forward for screening, he added.
HealthNews
Little-Known ‘Syndrome’ Causes Distress Among Some Women


Lifestyle
‘BUTTON OF DESPAIR’
Little-Known ‘Syndrome’ Causes Distress Among Some Women
One woman’s viral video sparked debate over a phenomenon called “sad nipples.”
Millions of women are discovering they may share a strange symptom they once assumed was unique: a sudden wave of sadness, dread, or even “impending doom” triggered by something as simple as a nipple brushing against clothing.
The phenomenon, informally dubbed “sad nipple syndrome” online, went viral after one woman described a “feeling of deep and unexplainable overwhelming sadness and guilt” whenever her nipple grazed something.
The video has racked up more than 9 million views, with women flooding the comments in disbelief that others experience the same thing.
Others dubbed the area the “button of despair,” describing the nauseating sensation as “maybe the worst feeling ever.”
Though the phenomenon is not recognized as a formal medical condition, experts say there may be biological explanations for why some women experience an intense emotional reaction to nipple stimulation.
Dr. Susanna Unsworth, an intimate health expert at Intimina, told Tyla that hormonal shifts could play a role.
“Nipple and breast stimulation are known to affect oxytocin levels, so it is biologically plausible that similar mechanisms could contribute to these emotional responses in some non-lactating individuals too,” she said.
Unsworth pointed to the closest known medical comparison: dysphoric milk ejection reflex, or D-MER, a condition experienced by some breastfeeding mothers that causes sudden feelings of sadness, anxiety, dread, or other negative emotions when milk is released.
Researchers believe D-MER may be linked to a brief drop in dopamine—a neurotransmitter associated with pleasure and reward—that occurs as milk production hormones are activated.
Although several women experiencing the viral phenomenon say they are not breastfeeding, experts say the overlap is worth exploring.
A study published in the National Library of Medicine found that nipple stimulation can increase oxytocin levels even in nonlactating women.
That finding has prompted some experts to wonder whether a similar hormonal mechanism could be involved for women suffering from “sad nipples.”
“This raises a biologically plausible—though as yet unstudied—question about whether the same dopamine mechanism may be at play in women who have never breastfed,” OB/GYN Dr. Melissa Walsh told the New York Post.
Many women sharing their experiences online said the feeling began long before pregnancy or breastfeeding entered the picture.
“Happened to me since I was a kid, and it was awful once I had a kid,” one commenter wrote in response to suggestions that the phenomenon could be linked exclusively to D-MER.
Dr. Ari Hoschander, a plastic surgeon in New York, told the Post that the reports sound more like physiological responses than psychological ones.
“What [they’re] describing sounds like that dopamine drop hitting particularly hard,” he speculated.
Walsh said recognizing a possible biological explanation can be reassuring for women who experience the phenomenon.
Many women in the comments appeared to agree.
“I didn’t experience [sexual trauma] and I have this feeling. I don’t think it’s a trauma response,” one woman wrote.
Hoschander noted that the nipple-areola complex is among the most neurologically dense areas of the body, meaning stimulation can trigger surprisingly powerful reactions.
The good news, he said, is that the feelings typically pass as quickly as they arrive.
While women have found community online around the experience, research into the phenomenon remains limited.
For those struggling with recurring symptoms, Unsworth recommends identifying potential triggers—including certain clothing fabrics—and practicing relaxation techniques. In more severe cases, she said cognitive behavioral therapy may help.
“This is an area that highlights how much more research is needed into women’s hormonal and neurobiological experiences,” Unsworth said.
Unlock a year of full access to The Looker and The Daily Beast for $35.
Recommended
AnnualSave 47 %
$35Year One
then $ 59.99 yearly
Discounted annual rate
Access to all articles (web + app)
Ad-free exclusive newsletters
Commenting Access
Daily crossword
Sneak peek of launches & events
Monthly
$1Welcome Offer
then $ 5.99 monthly
Access to all articles (web + app)
Ad-free exclusive newsletters
Commenting Access
Daily crossword
Sneak peek of launches & events
Ad-Free
$99Year One
then $ 119.99 yearly
Premium ad-free reading
Access to all articles (web + app)
Ad-free exclusive newsletters
Commenting Access
Daily crossword
Sneak peek of launches & events
Looks like you already have a subscription!
You’re all set!
Thanks for subscribing.
HealthNews
Trial Drug Could Clear Toxic Alzheimer’s Proteins and Restore Memory

A copper-based drug could offer a new route to tackling Alzheimer’s disease, after researchers found it reduced toxic proteins in the brain while improving memory in laboratory studies.
Scientists at Monash University reported that the compound, known as Cu(ATSM), not only lowered levels of amyloid-beta—a protein strongly linked to Alzheimer’s—but also improved long-term spatial memory.
Their findings, published in ACS Chemical Neuroscience, point to a treatment that targets the brain’s waste-removal system, a process known to break down in people with the disease.
Read More on Health
How Toxic Proteins Build Up in Alzheimer’s
Alzheimer’s develops in part due to the build-up of amyloid-beta in the brain. Under normal conditions, these proteins are cleared away through the blood-brain barrier, a protective layer that controls what enters and leaves the brain.
However, this system becomes less efficient over time in Alzheimer’s patients, allowing harmful proteins to accumulate.
A central role in this process is played by P-glycoprotein (P-gp) pumps—transport proteins that help move waste products out of the brain and into the bloodstream. When these pumps lose function, the brain’s ability to clear toxic material is significantly reduced.
What the Study Found About Cu(ATSM)
The new study shows that Cu(ATSM) may help restore this system by increasing the number and activity of these pumps. Lead author Dr. Jae Pyun explained that the treatment works by improving the function of the brain’s blood vessels, leading to both lower toxic protein levels and better cognitive performance.
“This is the first study to show that Cu(ATSM) can increase the abundance of P-gp clearance pumps in an Alzheimer’s model, by 24.1 percent, effectively linking the repair of the blood-brain barrier to a reduction in toxic proteins and improved cognitive function,” Dr. Pyun said.
The team found that restoring this waste-removal pathway had a measurable effect. “By improving the pumps, the brain can finally clear out the trapped waste. Over 56 days, the treatment reduced toxic amyloid-beta by 42 percent and improved spatial learning by nearly 44 percent.”
The results suggest that repairing the blood-brain barrier could be key to slowing or reversing some of the damage seen in Alzheimer’s disease.
A Drug Already Tested in Other Conditions
Senior author Professor Joseph Nicolazzo said the drug could move toward human trials more quickly than some other experimental treatments. That is because Cu(ATSM) has already been tested for safety in other neurological conditions.
“Cu(ATSM) is a copper compound with anti-inflammatory and neuroprotective properties that has already progressed to clinical testing for conditions like Parkinson’s and ALS,” Nicolazzo said.
He added that the reduction of amyloid in the brain is a meaningful target for improving symptoms. “Because reducing amyloid burden is clinically proven to improve functional outcomes, these preclinical results strongly support the rationale for testing this drug in early symptomatic Alzheimer’s disease.”
What Remains Unknown
While the findings are promising, researchers are still working to understand exactly how amyloid-beta leaves the brain once the barrier is restored. One theory is that Cu(ATSM) may also boost the activity of microglia—immune cells that help break down toxic proteins.
Dr. Dayan Goodenowe, a Ph.D. neuroscientist who is not directly connected to this specific study, told Newsweek that targeting the blood-brain barrier and waste-clearance systems is a promising area because Alzheimer’s is not just a plaque-storage problem.
“Alzheimer’s involves the biological environment of the aging brain and including membrane biology, inflammation, vascular function, lipid metabolism and cellular resilience… All of those components…” he said. “So any SINGLE mechanism still has to be validated before we know whether it produces meaningful clinical benefit.”
According to Goodenowe, the biology suggests that amyloid may be influenced by the broader lipid environment of the brain.
“The key question is not simply whether amyloid changes, but whether the intervention improves cognition, function and outcomes in humans,” he said. “The research must move from mechanism and preclinical work to human safety, dose, efficacy and ultimately FDA governed validation.”
What This Could Mean for Future Treatment
Further studies will explore these pathways in more detail. For now, the results highlight the potential of therapies that target both blood vessel function and protein clearance mechanisms in the brain.
HealthNews
New Research Pinpoints Hidden Brain Trigger That Causes Autism, Changing How We Understand The Condition

ADVERTISEMENT
For years, mainstream neurodevelopmental research overwhelmingly focused on abnormalities within the cerebral cortex—the brain region responsible for thinking, learning, and processing information—as the primary driver of autism.
However, a May 2026 study suggests that another part of the brain, the cerebellum, may play a much larger role than ever thought.
Highlights
New research suggests that autism may not originate solely in the brain’s thinking centers.
Scientists uncovered how changes in the cerebellum may influence the social difficulties associated with autism.
A second study identified two biological subtypes of autism that could reshape future diagnosis and treatment.
Researchers discovered that perineuronal nets (PNNs), the tiny supportive structures surrounding cerebellar neurons, help maintain healthy communication across brain networks involved in social behavior.
When these structures were disrupted, social interactions changed, offering a fresh perspective on the biological mechanisms that may contribute to autism spectrum disorder (ASD).
RELATED:
Disrupted cerebellar support cells were found to affect social behavior linked to autism
Image credits: Unsplash (Not the actual photo)
The study was conducted by Japan’s Kanazawa University, and the results were published in the journal Translational Psychiatry on May 13.
ADVERTISEMENT
The researchers examined two different mouse models of autism for the purpose.
Image credits: Pexels (Not the actual photo)
In one model, autism-like traits were induced by exposing mice to valproic acid before birth, while in the other, the mice carried a mutation in the autism-associated gene CHD8.
Despite their different origins, both models showed a significant loss of perineuronal nets (PNNs) in the cerebellum.
Image credits: Pexels (Not the actual photo)
To understand the impact of this change, scientists deliberately disrupted PNNs in healthy mice.
This yielded striking results, with mice showing damaged PNNs exhibiting reduced social interaction and less interest in unfamiliar mice — behaviors commonly associated with ASD.
ADVERTISEMENT
Further experiments revealed why this happened.
Image credits: Pexels (Not the actual photo)
In healthy mice, social interactions activated neurons in the cerebellum, which then sent signals to other brain regions involved in processing social information. When PNNs were disrupted, this neural activity dropped significantly, weakening communication across multiple brain networks.
ADVERTISEMENT
Image credits: Unsplash (Not the actual photo)
The team also identified a key molecular player called ARNT2. Levels of this protein increased when PNNs were lost, making neurons less responsive.
Reducing ARNT2 activity restored both normal brain function and social behavior in the mice.
The findings suggest that autism-related social difficulties may not stem solely from changes in the brain’s thinking centers. Instead, structural changes in the cerebellum and the networks it controls could also play an important role.
ADVERTISEMENT
While more research is needed to determine whether the same mechanism exists in humans, the study offers a promising new direction for understanding the biology of autism.
The study came shortly before another research effort identified two subtypes of autism
Image credits: Unsplash (Not the actual photo)
This study, titled Autism Subtypes Identified Using Cross-Species Functional Connectivity Analyses, was led by researchers at the Instituto Italiano di Tecnologia in Rovereto, Italy, and the Child Mind Institute in New York, with additional contributions from the University of Trento.
Their findings were published in Nature Neuroscience on May 15.
Image credits: Pexels (Not the actual photo)
ADVERTISEMENT
ADVERTISEMENT
Researchers examined brain scans from 20 different mouse models that showed autism-like traits, as well as scans from 940 children and young adults with autism and 1,036 neurotypical individuals.
They were looking for differences in how various parts of the brain communicate with one another.
The analysis revealed two main patterns.
Image credits: Unsplash (Not the actual photo)
First was a hypoconnectivity group, where autism was associated with reduced brain connectivity. Here, brain activity was linked to genes involved in synaptic junctions that enable brain cells to communicate.
Then there was a hyperconnectivity group, associated with increased connectivity across the brain. The group’s brain patterns were linked to genes related to the immune system and showed measures of slightly more severe autism.
Because the same patterns were found in both mice and humans and replicated across multiple datasets, the researchers believe these patterns may represent real biological subtypes of autism.
ADVERTISEMENT
If future research confirms these subtypes and reliable diagnostic methods are developed, it could lead to more personalized treatments tailored to each subtype.
This wasn’t the first time researchers tried to spot matching patterns and split autism into several types
Image credits: Unsplash (Not the actual photo)
A study published in July 2025 by researchers from Princeton University, the Simons Foundation, and the Flatiron Institute identified four types of autism in a group of 5,000 children.
Instead of using brain imaging, the researchers defined these types by analyzing more than 230 behavioral characteristics.
Other studies have suggested that autism can appear differently depending on when it develops, such as in early childhood, late childhood, adolescence, or young adulthood.
Together, these studies aim to improve how autism is identified and understood.
Image credits: Unsplash (Not the actual photo)
ADVERTISEMENT
ADVERTISEMENT
The researchers believe that larger datasets and more advanced analysis methods will help uncover additional autism subtypes in the future.
The team behind Autism Subtypes Identified Using Cross-Species Functional Connectivity Analyses has made its data and analysis tools publicly available, enabling other scientists to build on its findings.
“Our cross-species approach provides an advanced translational framework for a multidimensional, biologically grounded stratification of autism,” the researchers wrote in the published paper.
“Our database is openly available to the research community, supporting future investigations into autism-related connectivity alterations,” they added.
“I have three kids, all diagnosed with autism. I am realizing I am also autistic. Genetics!” a netizen wrote
ADVERTISEMENT
ADVERTISEMENT
ADVERTISEMENT
ADVERTISEMENT
ADVERTISEMENT
HealthNews
ALS Patient, 47, Gains Ability to Speak and Sustain Full-Time Job Using Experimental Brain-Computer Interface
Researchers at UC Davis have created an advanced brain-computer interface that can allow people with severe paralysis to communicate, work and interact with the digital world. In a new study published in Nature Medicine, a team of scientists at the University of California, Davis detailed a years-long study of a brain-computer interface (BCI) that has been equipped with “advanced decoding algorithms that translate neural signals into text and enable cursor control,” as stated in a press release shared by UC Davis Health. This means that the user can fully interact with a personal computer without the need for researcher support.


Cervical cancer deaths in England reach historic low. #BBCNews


Ukraine launches largest attack on Moscow in two years, Russian media reports
Ukraine launched its largest drone offensive on Moscow in two years on Thursday, according to Russian state-run news agency …


Apple’s Tim Cook: iPhone price increase ‘unavoidable’
We’re still three months or more away from the unveiling of the iPhone 18, and outgoing Apple CEO Tim Cook...


Big John tells us who he's backing to win the World Cup. #BigJohn #England #WorldCup #BBCNews


Strait of Hormuz reopening may take weeks
Stringer | Reuters It will take weeks to clear the backlog of ships in the Strait of Hormuz, industry executives...


Daveigh Chase, who starred in ‘Lilo & Stitch’ and ‘The Ring,’ dies at 35
Daveigh Chase, a former child actor known for voicing Lilo in Disney’s animated Lilo & Stitch and playing Samara in...


Ms. Juicy Gets Emotional With Cops, Shouts ‘I’m Going to Jail?’ Before Arrest
Ms. Juicy was frightened after police told her she was going to be arrested and taken to jail … and...


Netflix’s new Harlan Coben show is ludicrous
Last year, there was plenty of chatter about Netflix’s alleged directive for writers and showrunners to dumb down stories, lest...


Daveigh Chase, voice behind Lilo and Chihiro, dies at 35
Actress Daveigh Chase, known for beloved animated roles like the voice of Chihiro in “Spirited Away” and Lilo in “Lilo...


Harry and Meghan to visit UK with family for the first time in 4 years, British media reports
Britain’s Prince Harry and his family will return to the United Kingdom for a visit next month, British media reported...
-

 Business5 days ago
How much of Musk’s wealth comes from government help? Virtually all of it
-

 LifestyleNews2 weeks ago
120 minutes of strength training per week may help extend lifespan
-

 Politics7 days ago
What to know about the stabbing that set off fiery riots in Northern Ireland
-

 Video6 days ago
Download fans say what they love about the festival. #DownloadFestival #BBCNews
-

 Video6 days ago
Why SpaceX IPO isn't about space. #SpaceX #ElonMusk #BBCNews
-

 HealthNews6 days ago
The people of Okinawa, Japan only eat until they are about 80 percent full, then stop — and the practice has been linked in multiple peer-reviewed studies to lower rates of cardiovascular disease, slo
-

 TravelNews6 days ago
My Paternal Instinct Should’ve Warned Me About Netflix’s Maternal Instinct
-

 Food5 days ago
Pope Leo’s plane was grounded. Then the King of Spain stepped in to help